Neuphony’s Guide to Understanding Brainwaves

By following these steps and adhering to the professional considerations, you can leverage the power of EEG analysis to gain valuable insights into brain function, optimize cognitive performance, and inform evidence-based interventions for individuals seeking to improve their mental well-being.

Setting Up Device
Connecting Sensors On Scalp
  1. Ensure a snug fit of the cap/headband by tightening the straps securely. b. Connect reference sensors, confirming their activation on the desktop app. c. Proceed to connect remaining sensors by either adjusting the headband or twisting sensors on the FlexCap.

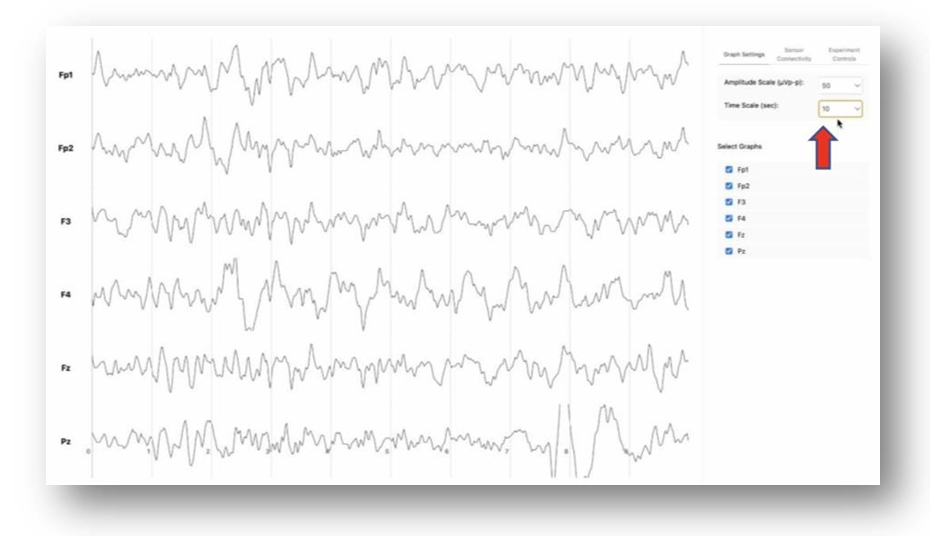
A) On the ‘Raw Data’ screen, configure ‘Graph Settings’ as follows:

  • Amplitude Scale (μVp-p): 100
  • Time Scale (sec): 10
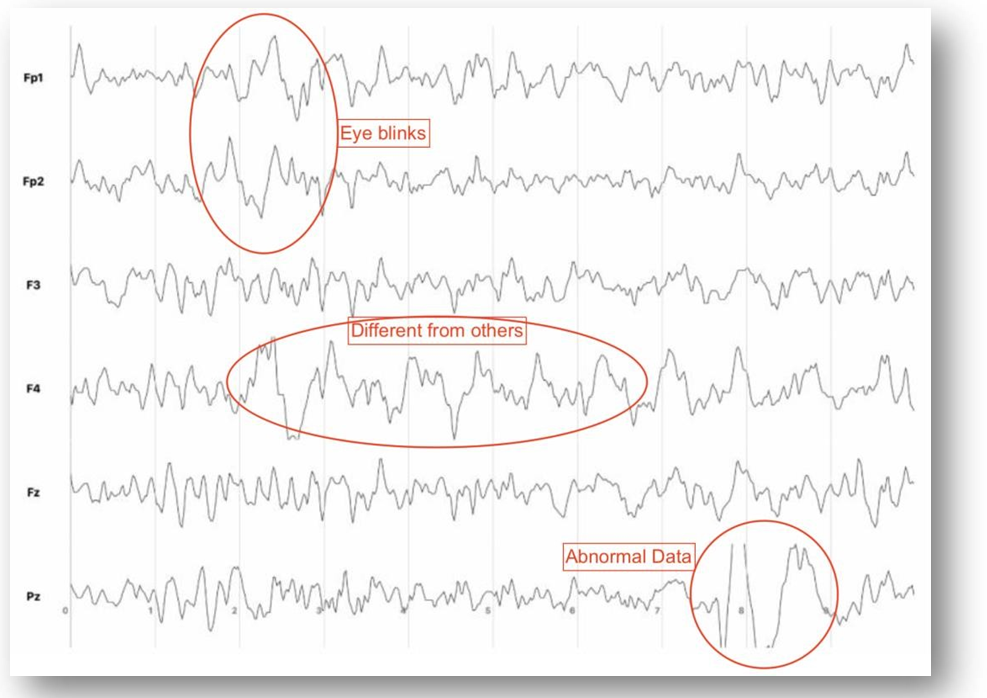
Several anomalies may compromise the quality of EEG data collected from dry sensors. Identifying and addressing these anomalies is imperative for accurate interpretation.

Poor Contact
  1. Incomplete contact between sensor and scalp, leading to low signal amplitude and high impedence
    • Flat or noisy signals compared to nearby
    • Visible air gaps between the sensor and the scalp.

Scalp or hair movement due to participant activity, muscle engagement, or perspiration

    • High-frequency noise
    • Erratic fluctuations in signal amplitude.

External electrical noise from sources like power lines, computers, or electronic devices

    • Consistent 50/60Hz hum in the
    • Spikes or bursts of noise unrelated to brain

Hardware failure or sensor

    • Complete absence of signal from a specific
    • Erratic or distorted signals differing from other
  1. Identify flat lines on Fp1 and Fp2 These could possibly indicate eye blinking.
  2. Ensure consistency in graphs between corresponding sensors on the left and right
Baseline Assessment
  1. Preparation: Ensure the subject is seated comfortably with closed eyes for 2-4 minutes, minimizing movement or mental effort
  2. Data Acquisition: Commence EEG recording, utilizing Fast Fourier Transform (FFT) analysis in Relative and Histogram mode to assess the relative power of Delta, Theta, Alpha, Beta, and Gamma frequency bands.
  3. Channel Analysis: Identify channels with significant bandwave power deviations, focusing on relative differences for potential imbalances.
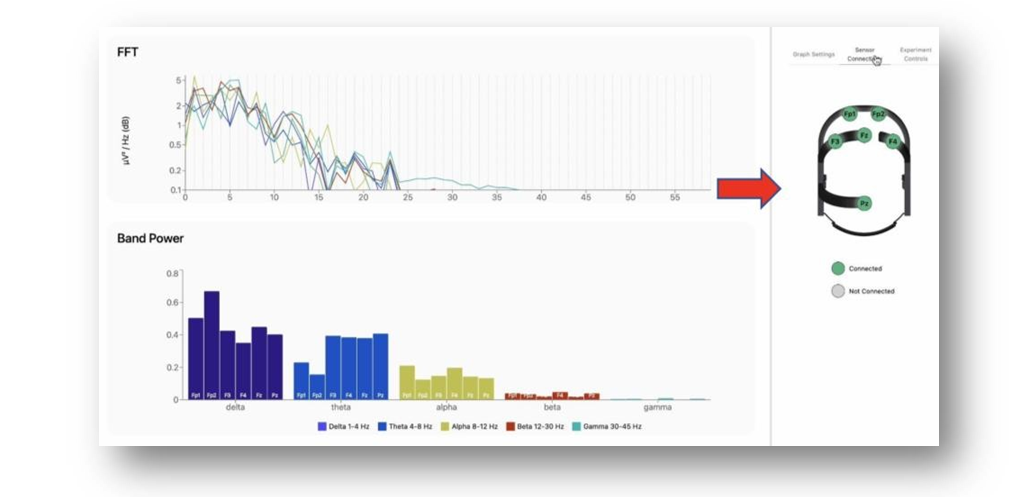
  1. Interchannel Variability: Identify pronounced discrepancies in bandwave power between channels, suggesting deviations from normal functional connectivity.
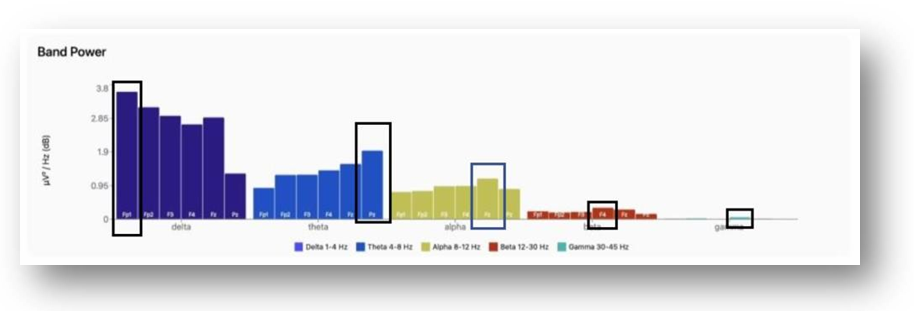
  2. Intrachannel Extremes: Examine individual channels for unusually high or low activity within specific frequency bands, considering associated functions
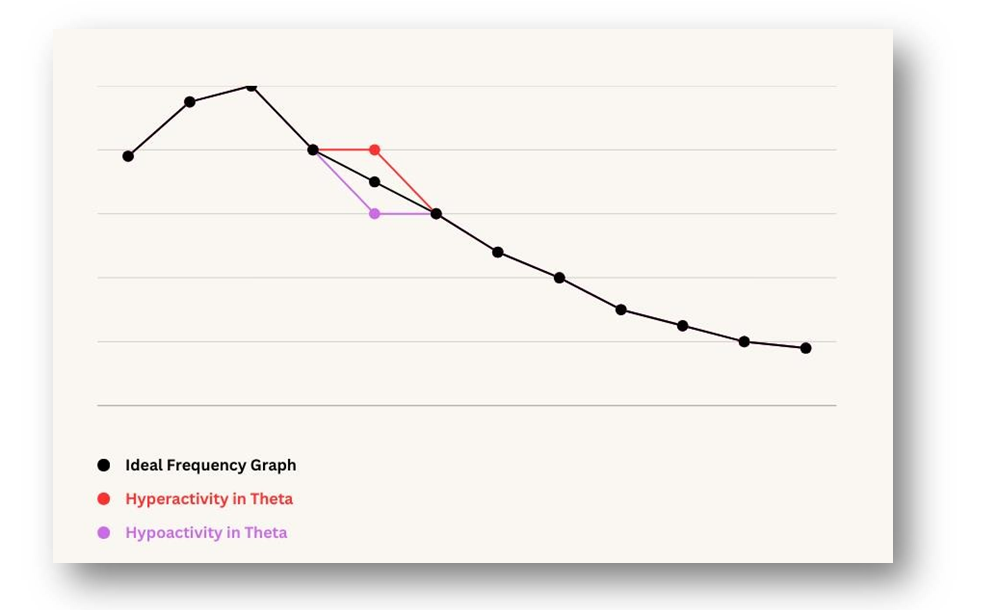
  3. Visual Interpretation: Analyze graphed data for deviations, indicating hyperactivity or hypoactivity, highlighting potential areas of dysfunction.
  1. Functional Localization: Refer to the Brodmann Area chart to correlate identified bands and channels with specific brain regions and
Site Brodmann Area Brain Function
Fpz 10 (11) Poor Response Inhibition Ventro Medial Forebrain Bundle – Emotional Inhibition
Fp1 10 (11, 46) Verbal, Episodic Retrieval Visual Working Memory
Fp2 10 (11, 46) Face & Object Processing – Emotional Inhibition, Verbal Episodic Memory
F7 45 (38, 44, 46) Visual & Auditory Working Memory BA 46 Divided & Selective Attention Broca’s Area – Semantic Short- Term Buffer
F8 47 (10, 46, 45) Working & Visual / Spatial Memory (Short Term Buffer) Face Processing, Emotional Processing, Sustained Attention BA 45
F3 8, 9 (46, 45, 44, 11, 8) Verbal Episodic Retrieval, Object Processing Emotional Interpretation (Some Facial Recognition) Poor Response Inhibition – BA 9
F4 8, 9 (46, 45, 44, 11, 8) Verbal Episodic Retrieval, Semantic Retrieval – BA 8 Sustained & Selective Attention – BA 8 Vigilance Area, Impulse Control
Fz 8, 9 Anterior Cingulate, Internal vs External Attention – Most Active During Internal Attention Processing Personality Changes
C3 4, 3 (6, 5, 7, 40) Sensory Motor Functions Short Term Memory – BA 40
Cz 4, 3, 12 Basal Ganglia (Thalamic Efferent VA) Substantia Nigra (Thalamic Efferent VL)
C4 4, 3, (6, 5, 7, 40) Sensory & Motor Functions Short Term Memory – BA 40
T3 21 (22, 20, 52, 38) Language Comprehension – BA 22, Inner Voice Wernicke’s Area, Declarative Memory Long Term Memory – Amygdala / Hippocampal Area
T4 21 (22, 20, 52, 38) Personality – BA 21, 38 Categorization & Organization Auditory Cortex – Music Processing
T5 37 (21, 22, 39, 19) Short-Term Memory – BA 37, Inner Voice Angular Gyrus – Meaning Construction
T6 37 (21, 22, 39, 19) Long-Term Memory – BA 21, Facial Recognition – Emotional Content
P3 7 (39, 40, 19, 7) Acalcula – BA 39 Angular Gyrus – Meaning Construction
Pz 7 (5,19) Agnosia, Apraxia – BA 7 Attentional Shifting Area – Perseverance
P4 7 (5,19) Visual – Spatial Sketch Pad, Vigilance
O1, O2 18 (19) Visual Processing, Procedural Memory, Dreaming
Oz 17 (18, 19) Visual Processing Hallucinations
 
  • Tailored Interventions: Develop targeted interventions based on Brodmann Area findings, incorporating cognitive training, behavioral modifications, or evidence-based
  • Alternative Approach: Consult the provided table linking hyperactive bands and channels to recommended actions for quick
 
Sensor Location Dominating Brainwaves Recommendation
Pz Beta Guided Meditation
Fz Beta Breathing techniques or neurofeedback from mobile application
Pz Alpha Theta Meditation (deep relaxation) or Self-Reflective meditation (mindfulness). Also try neurofeedback as volume will increase when Pz has alpha.
Fz Alpha Music Therapy, Body Scan
Pz Theta Chanting (compassion building)
Fz Theta To increase focus – real time neurofeedback from mobile application.
Fp2 & Fp4 Beta Quizes, games, puzzles (Goal will be to Build analytical processing)
Fp1 & Fp3 Beta Chanting, transcendental meditation
Fp2 & Fp4 Alpha Mindfulness (if we want to process emotions) Theta Meditation (deep relaxation)
Fp1 & Fp3 Alpha Chanting (deep relaxation or compassion) Quizes, puzzles, guided meditation (Gaining attention and coming back to moment)
Fp2 & Fp4 Theta If goal is emotional processing, then guided meditation
Fp1 & Fp3 Theta If goal is improved focus, then breathing and coming back to moment
  1. Below 8 suggests sleep deprivation or requires a doctor’s
  2. Above 12 indicate hyperactivity, also requiring a doctor’s
  3. 11-12 imply highly stimulated maybe through pain killer or Caffeine,
  1. Task-Specific Recordings: Introduce tasks like reading, mental imagery, or emotional recall after capturing the baseline to observe adaptive changes in brainwave activity
  2. Dynamic Functional Mapping: Compare task-related EEG data to the baseline to identify areas of increased or decreased activity, providing insights into individual brain networks and dynamic interactions.